ABOUT ME
I approach projects by breaking complex problems into something clear, structured, and workable. Whether it’s spatial data, event logistics, or client requests, I focus on understanding what’s actually needed before jumping into solutions.
I like spreadsheets
& long scripts in R
My background spans market development, event operations, and now geospatial analysis. Across those roles, I’ve worked closely with all sorts of people (clients, vendors, students, and the public) on translating between technical details and real-world outcomes.
That experience carries into my current work in GIS, where I combine spatial analysis with clear communication. I’m particularly interested in projects that sit at the intersection of infrastructure, the environment, and public experiences where data can directly inform better decisions.
I tend to work systematically: exploring options, refining ideas, and making sure the final output is both functional and easy to understand.
Here’s a recent example of my work:
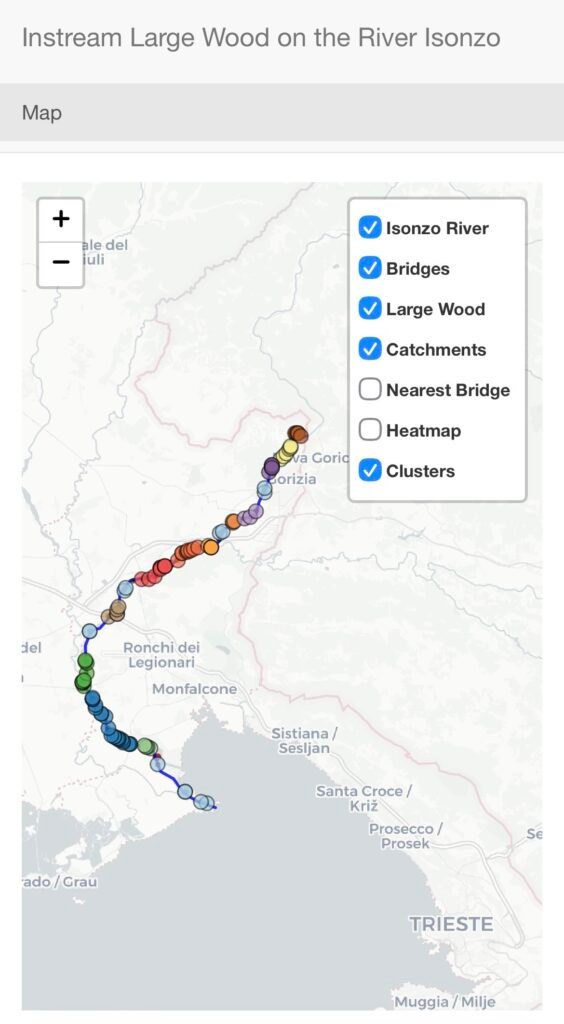
PINCH TO ZOOM 〜 PRESS FOR NDVI VALUES
This interactive map contains layers used to assess vegetation health. The main layer is a high-resolution orthomosaic, overlaid with a multispectral Normalized Difference Vegetation Index (NDVI) layer. The layers can be toggled using the icon in the lower right corner.
I created the orthomosaic by stitching together drone images captured with a DJI Mavic 3M and processing them in Drone2Map by Esri.
NDVI measures vegetation “greenness,” a common indicator of plant health (Huang et al., 2021). Values range from -1 to 1, with higher values shown in green and lower values in red.
Huang, S., Tang, L., Hupy, J. P., Wang, Y. and Shao, G. (2021) ‘A commentary review on the use of normalized difference vegetation index (NDVI) in the era of popular remote sensing’, Journal of Forestry Research, 32(1), pp. 1–6.
What I do
I take projects from early ideas through to structured, finished outputs. Most of my work sits between data, mapping, and communication, with a focus on making information practical and accessible.
Geospatial Analysis
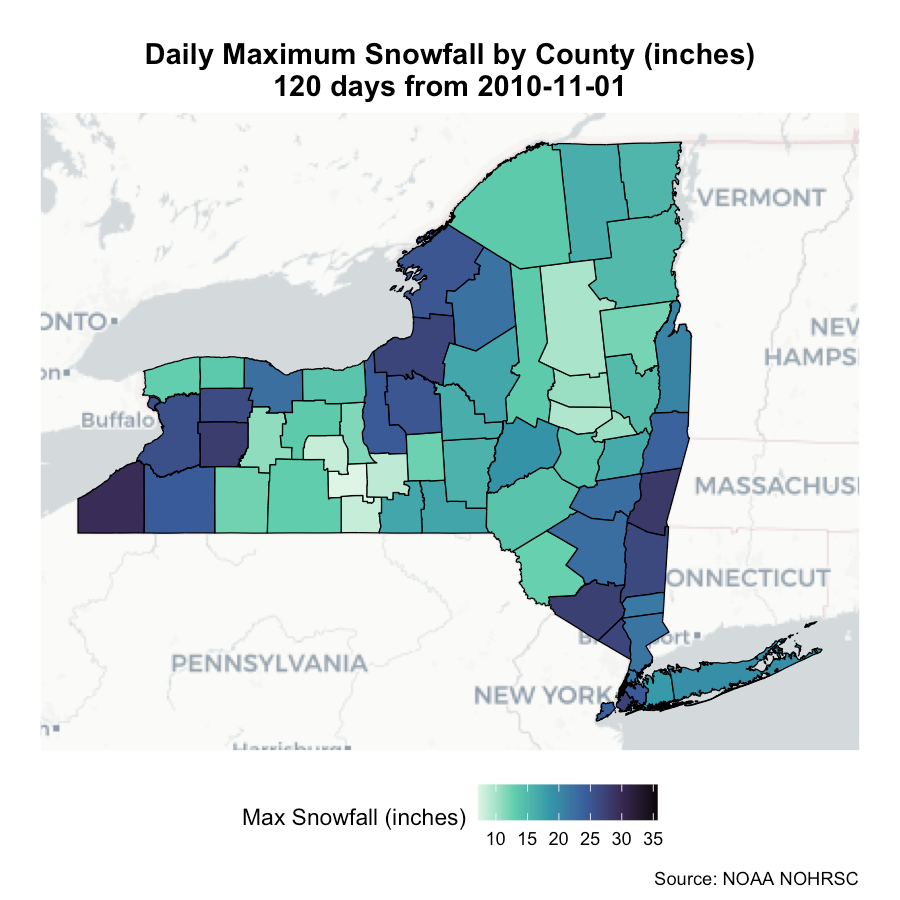
I work with spatial data to explore patterns, relationships, and real world impact. Using tools like QGIS and R, I carry out analysis across raster and vector data, including clustering and spatial modelling. The goal is to turn raw data into something meaningful and usable.
Data Visualisation & Mapping
Clear visualisation is just as important as the analysis itself. I design maps and figures that communicate results in a way that is intuitive and easy to follow. This includes interactive maps, static visuals, and exploratory tools that help people understand what the data is showing.
Applied Research & Problem Solving
A lot of my work starts with open ended questions. I am comfortable working through uncertainty by sourcing data, testing approaches, and troubleshooting along the way. I am particularly interested in projects where spatial thinking can support environmental planning, infrastructure decisions, and public facing outcomes.
Skills
My Experience
2019-2025
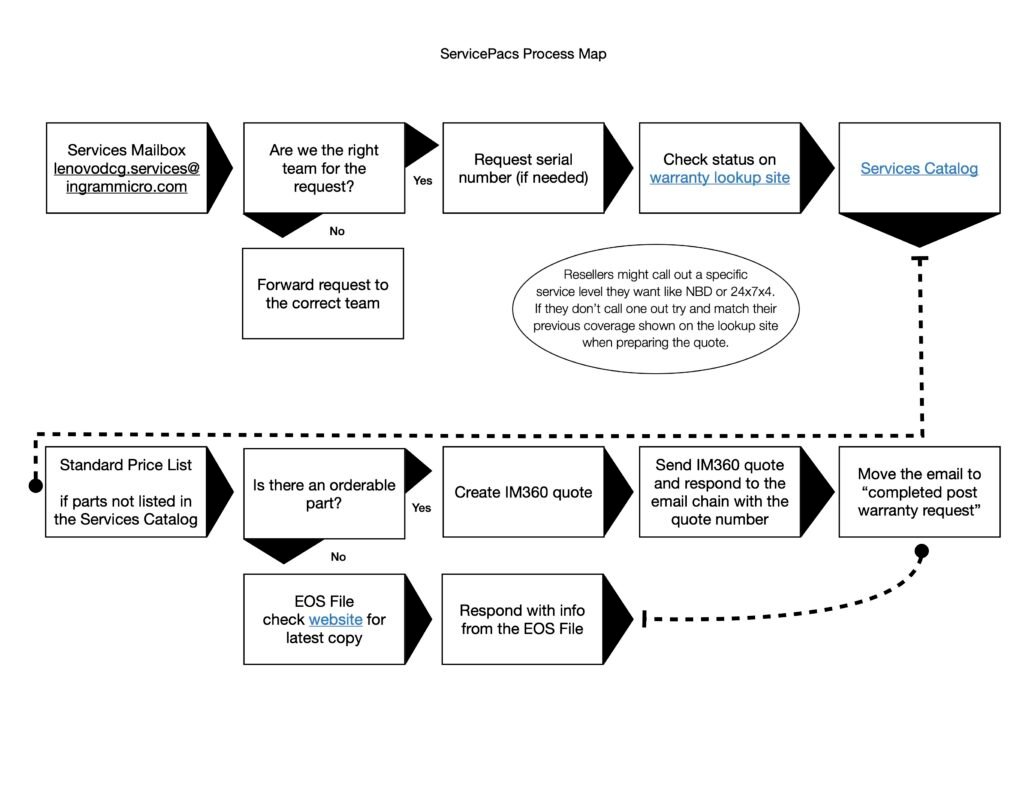
Ingram Micro
Platform Specialist II
Initially hired to support the Lenovo Server team and then shifted to support additional vendors with my skills in creative problem solving, multitasking, and communication.
2015-2019
Canalside Buffalo
Events Assistant
Seasonal position where I was promoted from the Info Kiosk to Events Assistant where I oversaw daily fitness classes and was a point of contact between the events staff, instructors, and participants
2017-2018
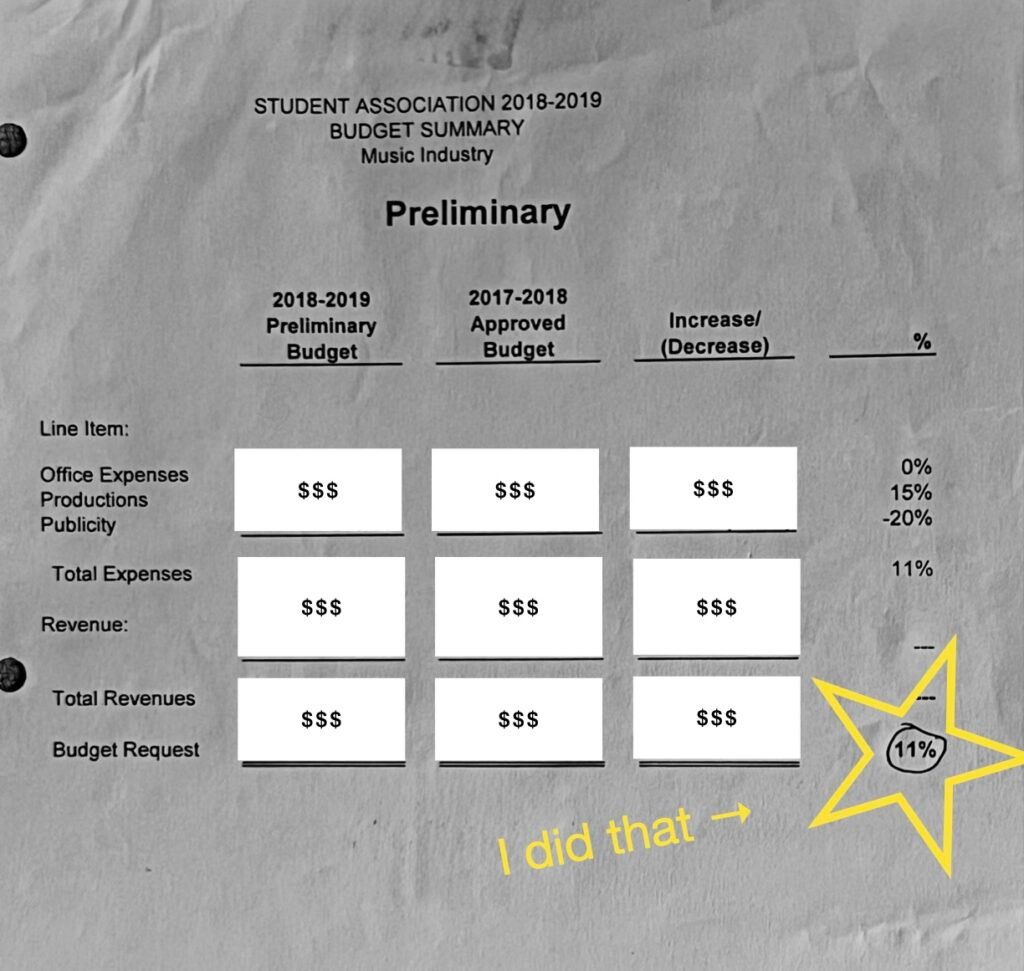
Music Industry Club – SUNY Fredonia
Club Treasurer
Elected to maintain a detailed budget that was easy to understand for fellow club leaders. Established communication between Student Affairs and the Music Industry Club to secure new and recurring club events.